
1
Please refer to important disclosures at the end of this report
1
1
Angel Top Picks – December 2019
FPI flow positive for the third month in a row – The Government announced cut in
corporate tax cuts on the 20th of Sep’19 post which FPI flows have turned positive.
FPI flows have now been positive for the third month in a row and at `25,231 for
November was the second highest in 2019 after March. Total flows for 2019 now
stands at `89,385 cr. as compared to outflow of `33,553 cr. for 2018.
High frequency data pointing to improvement on the ground - The Q2FY20 GDP
growth number at 4.5% probably marks the bottom in terms of growth rate.
Demand had been adversely impacted during the quarter due to multiple factors
like the credit crisis, extended monsoon and global uncertainty due to the US
China trade war. However management commentaries pointed to better festive
demand in 2019 than last year which was reflected in better auto and consumer
durable retail sales. Other high frequency data like the PMI too point to some
improvement as the manufacturing PMI rose to 51.2 in November from 50.6 in
October while the services PMI rose to 52.7 from 49.6. We therefore believe that
the worst is over and growth rates should start improving gradually from the
second half driven by Government spending and normalization of demand.
Valuations reasonable despite a moderate Q2FY20 result season- The Q2FY20
numbers were a mixed set of bag as the economic slowdown continued to weigh
on demand though abating cost pressures helped operating margins. Large
private corporate banks continued to report improvement in asset quality which
was another major positive in Q2 numbers. Full benefits of corporate tax cuts
would start reflecting from Q3FY20 numbers as there were significant deferred tax
reversals in Q2 due to the cut in corporate tax rates. Post the Q2FY20 numbers
consensus is for ~23% yoy growth in Nifty EPS for FY21 which is likely to be driven
by turnaround in large corporate banks along with benefit of lower tax rates for
the full year.
India to benefit from US China trade war - While the US China trade war is having
an adverse impact on global growth India is relatively immune given low share of
exports to GDP as compared to some of the other Asian countries. The US China
trade war however is an opportunity for India as some manufacturing capacities
would be moving out of China in order to de-risk their supply chain. With tax rates
in India now comparable to some of the other emerging economies we would be
in a better position to capture the opportunities thrown up by the disruption caused
by the trade war.
Top pick’s overview
We recommend our top picks as it has outperformed the benchmark BSE 100
since inception. We believe that consumer (both discretionary and non
discretionary) space and private sector banks (both corporate and retail) offers
good growth opportunity going forward despite volatile market environment.
Exhibit 1: Top Picks Performance
Return Since Inception (30th Oct, 2015)
Top Picks Return
52.2%
BSE 100
48.2%
Outperformance
4.0%
Source: Company, Angel Research
Exhibit 1:
Company
CMP (`)
TP (`)
Banking/NBFC
ICICI Bank
512
575
HDFC Bank
1274
1390
RBL Bank
374
440
Shriram Transport Finance
1127
1410
Consumption
Amber Enterprises
1037
1200
Blue Star
786
990
Safari Industries
571
646
Media/Automobiles
Maruti Suzuki
7250
8552
Real Estate/Infra/Logistics/Power
GMM Pfaudler
1651
2059
Larsen & Tourbo
1331
1809
Ultratech Cement
4256
4984
Source: Angel Research
Note: CMP as of November 29, 2019

2
Error!
Refer
ence
sourc
Angel Top Picks | December 2019
December 6, 2019
2
Top Picks
3
Error!
Refer
ence
sourc
Angel Top Picks | December 2019
December 6, 2019
3
Amber Enterprise
Amber Enterprises India Ltd. (Amber) is the market leader in the room air
conditioners (RAC) outsourced manufacturing space in India. It is a one-stop
solutions provider for the major brands in the RAC industry and currently
serves eight out of the ten top RAC brands in India.
In line with its strategy to capture more wallet share, it has made few
acquisitions in the printed circuit board (PCB) manufacturing space which
would boost its manufacturing capabilities.
We expect Amber to report consolidated revenue/PAT CAGR of 20%/32%
respectively over FY2019-21E. Its growing manufacturing capabilities and
scale put it in a sweet spot to capture the underpenetrated RAC market in
India.
Key Financials
Y/E
Sales
OPM
PAT
EPS
ROE
P/E
P/BV
EV/Sales
March
(` cr)
(%)
(` cr)
(`)
(%)
(x)
(x)
(x)
FY2020E
3,861
8.5
149
47.5
13.4
27.6
3.7
0.9
FY2021E
4,487
8.6
196
62.2
15.3
21.1
3.2
0.7
Source: Company, Angel Research
Blue Star
BSL is one of the largest air-conditioning companies in India. With a mere 3%
penetration level of ACs vs 25% in China, the overall outlook for the room
air-conditioner (RAC) market in India is favorable.
BSL's RAC business has been outgrowing the industry by ~10% points over the
last few quarters, resulting in the company consistently increasing its market
share. This has resulted in the Cooling Products Division (CPD)'s share in
overall revenues increasing from~23% in FY2010 to ~43% in FY2019
(expected to improve further). With strong brand equity and higher share in
split ACs, we expect the CPD to continue to drive growth.
Aided by increasing contribution from the Unitary Products, we expect the
overall top-line to post revenue CAGR of ~11% over FY2019-21E and
margins to improve from 5.7% in FY2018 to 6.8% in FY2021E.
Key Financials
Y/E
Sales
OPM
PAT
EPS
ROE
P/E
P/BV
EV/Sales
March
(` cr)
(%)
(` cr)
(`)
(%)
(x)
(x)
(x)
FY2020E
5866
6.3
215
22.4
23.1
35.1
8.1
1.3
FY2021E
6651
6.7
269
28.0
24.6
28.1
7.3
1.1
Source: Company, Angel Research
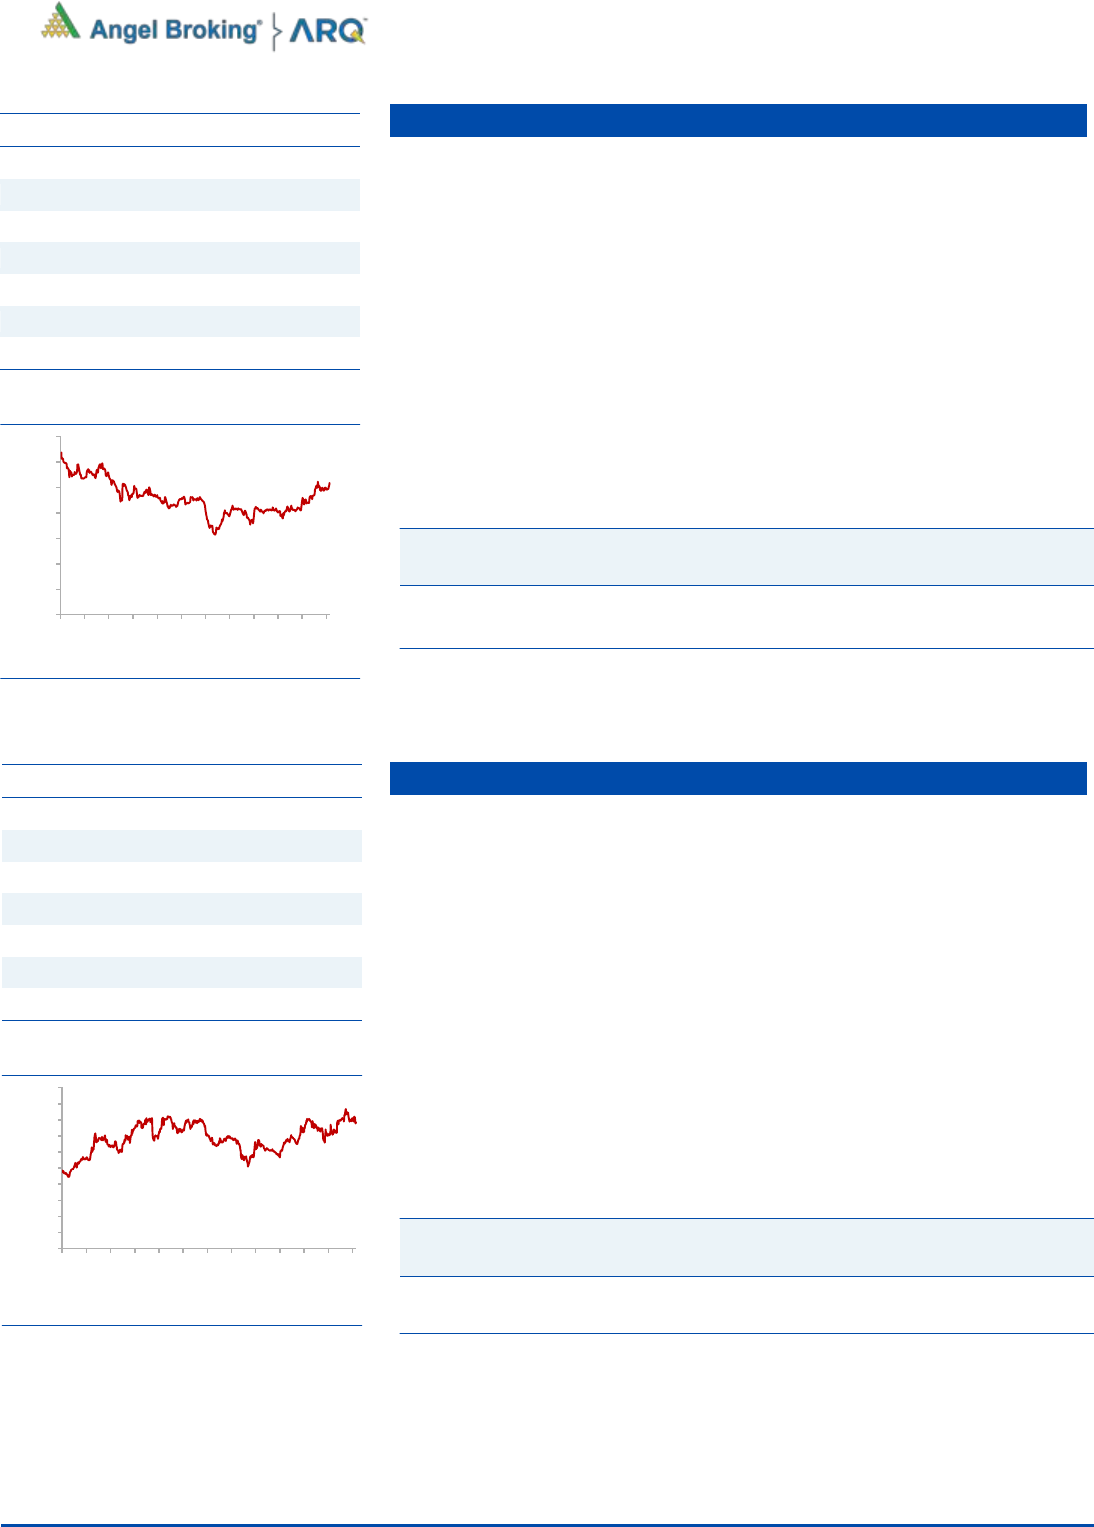
Stock Info
CMP
1,037
TP
1,200
Upside
16.3%
Sector
Electronics
Market Cap (` cr)
3,259
Beta
0.83
52 Week High / Low
1100/622
2 year-Chart
Source: Company, Angel Research
-
200
400
600
800
1,000
1,200
1,400
Jan-18
Mar-18
May-18
Jul-18
Sep-18
Nov-18
Jan-19
Mar-19
May-19
Jul-19
Sep-19
Nov-19
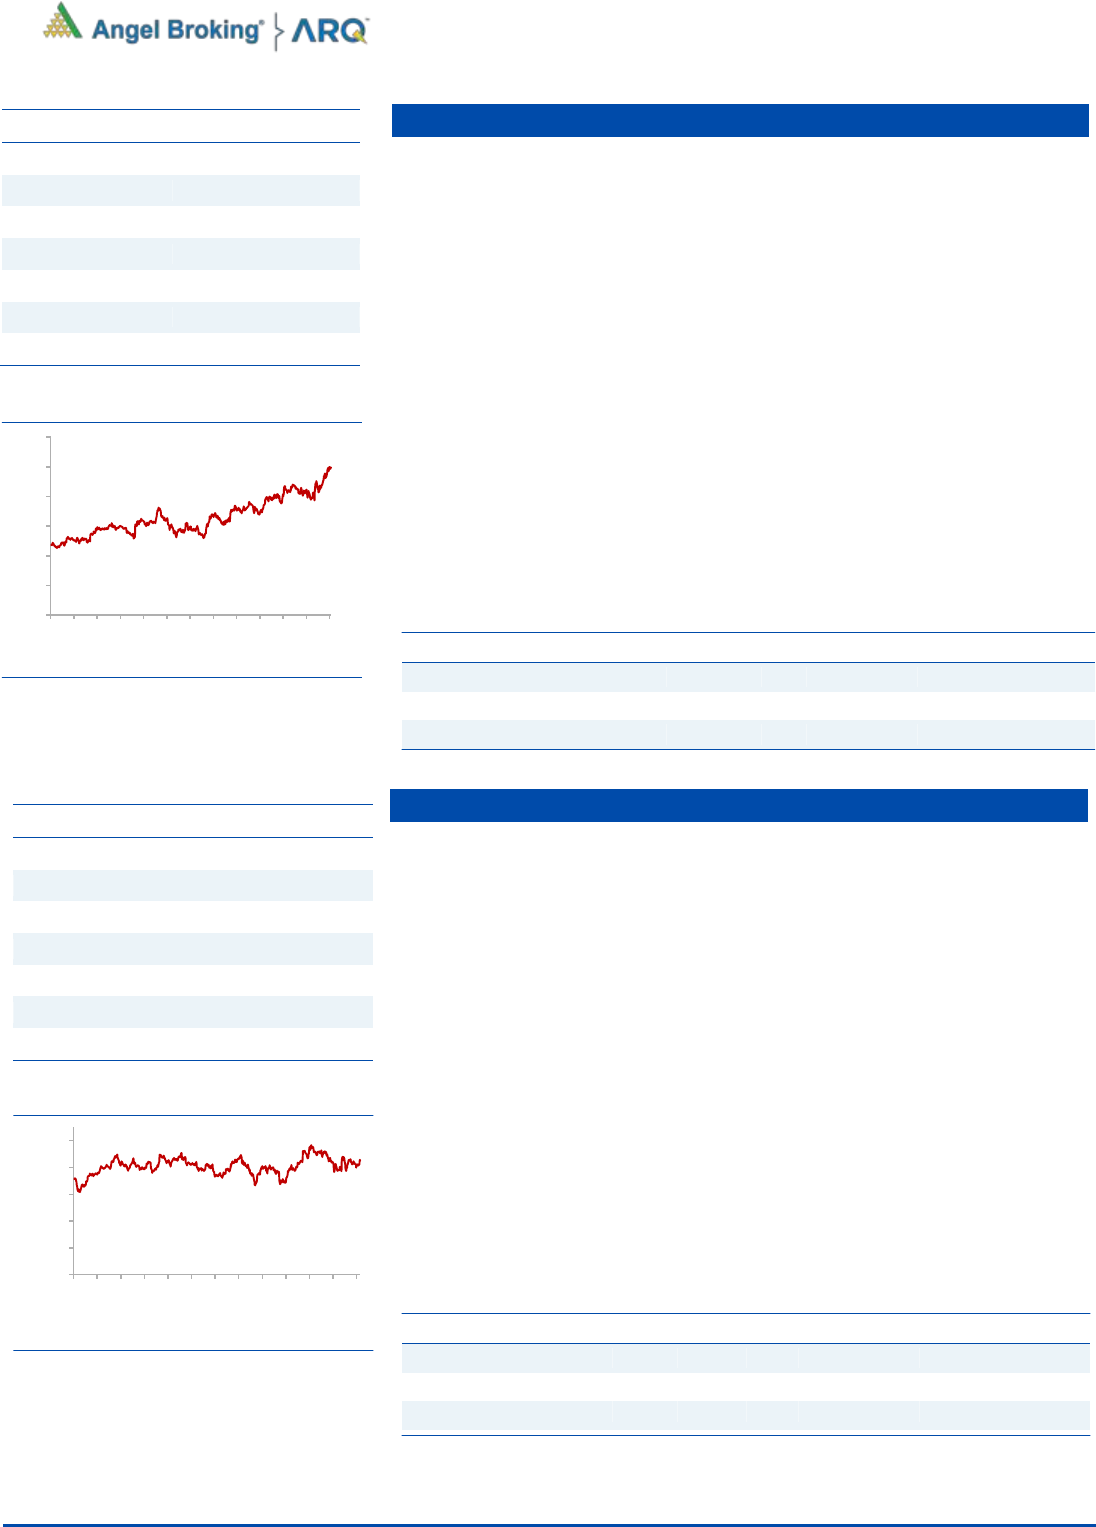
Stock Info
CMP
786
TP
990
Upside
26.0%
Sector
Cons.Durable
Market Cap (` cr)
7,569
Beta
0.67
52 Week High / Low
881/560
3 year-Chart
Source: Company, Angel Research
-
100
200
300
400
500
600
700
800
900
1,000
Dec-16
Mar-17
May-17
Aug-17
Nov-17
Feb-18
May-18
Aug-18
Nov-18
Feb-19
May-19
Aug-19
Nov-19

4
Error!
Refer
ence
sourc
Angel Top Picks | December 2019
December 6, 2019
4
GMM Pfaudler
GMM Pfaudler Limited (GMM) is the Indian market leader in glass-lined (GL)
steel equipment used in corrosive chemical processes of agrochemicals,
specialty chemical and pharma sector. The company is seeing strong order
inflow from the user industries which is likely to provide 20%+ growth outlook
for next couple of years.
GMM has also increased focus on the non-GL business, which includes mixing
equipment, filtration and drying equipment for the chemical processing
industry. It is expecting to increase its share of non-GL business gradually over
the medium term.
GMM is likely to maintain the 20%+ growth trajectory over FY19-21 backed
by capacity expansion and cross selling of non-GL products to its clients.
Key Financials
Y/E
Sales
OPM
PAT
EPS
ROE
P/E
P/BV
EV/Sales
March
(` cr)
(%)
(` cr)
(`)
(%)
(x)
(x)
(x)
FY2020E
685.0
18.1
91.7
62.8
25.5
26.3
6.7
3.3
FY2021E
815.0
18.1
120.3
82.4
26.1
20.0
5.2
2.7
Source: Company, Angel Research
HDFC Bank
HDFC Bank has planned to improve business with digital platforms and is
engaging with mid market clients. Its next leg of growth road map includes (1)
increasing branch opening number from 300 current to 600 annually in non
urban area, (2) increase point of sale (POS) 4x to 4mn by FY2021 and double
the virtual relationship manager clients in 3 years.
The bank registered NIM of 4.4% on the back of lower cost of funds, while
healthy asset quality kept the provision cost lower. Consistency in both the
parameters helped the bank to report healthy return ratio. Despite strong
advance growth, the bank has maintained stable asset quality (GNPA/NPA –
1.3%/0.4%).
HDFC Bank’s subsidiary, HDB Financial Services (HDBFS) continue to
contribute well to the banks overall growth. Strong loan book, well-planned
product line and clear customer segmentation aided this growth.
We expect the bank’s loan growth to remain 20% over next two years and
earnings growth is likely to be more than 20%.
Key Financials
Y/E
NII
NIM
PAT
EPS
ABV
ROA
ROE
P/E
P/ABV
March
(` cr)
(%)
(` cr)
(`)
(`)
(%)
(%)
(x)
(x)
FY2020E
57,126
4.4
26,640
48.7
309
2.0
16.9
26.2
4.1
FY2021E
68,121
4.3
33,355
61.0
358
2.1
18.1
20.9
3.6
Source: Company, Angel Research
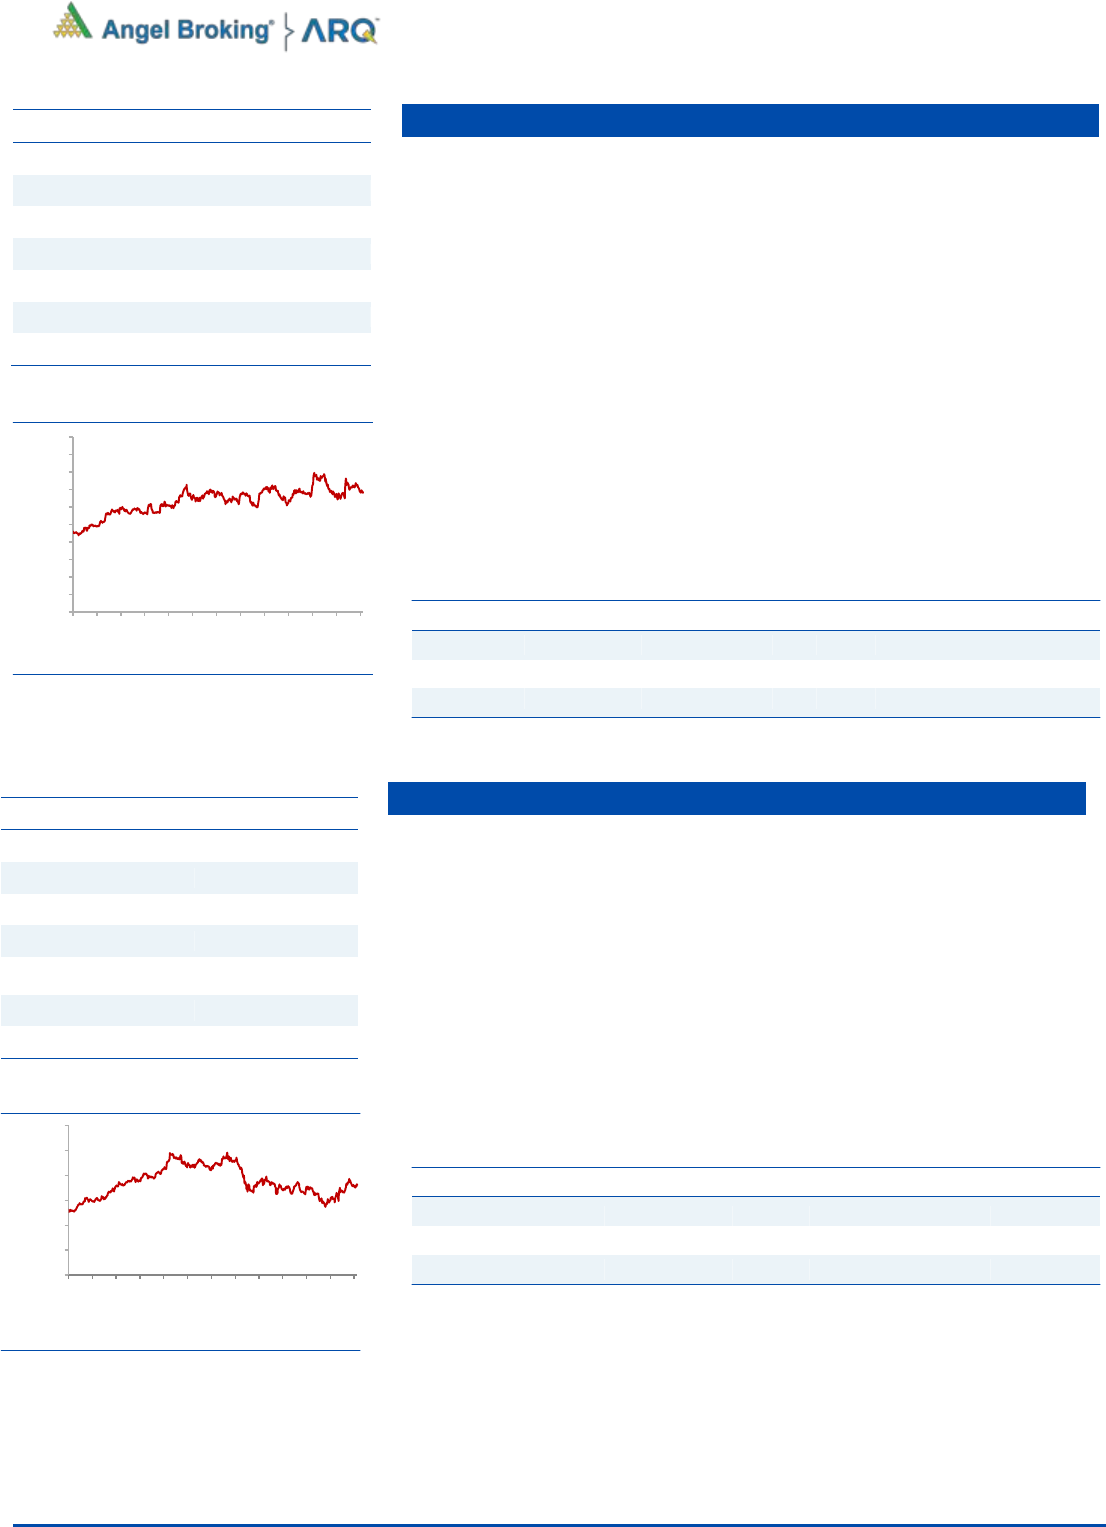
Stock Info
CMP
1,274
TP
1,390
Upside
9.1%
Sector
Banking
Market Cap (` cr)
697,726
Beta
1.01
52 Week High / Low
1,287/1,011
3 year-Chart
Source: Company, Angel Research
-
200
400
600
800
1,000
1,200
1,400
Dec-16
Mar-17
May-17
Aug-17
Nov-17
Feb-18
May-18
Aug-18
Nov-18
Feb-19
May-19
Aug-19
Nov-19
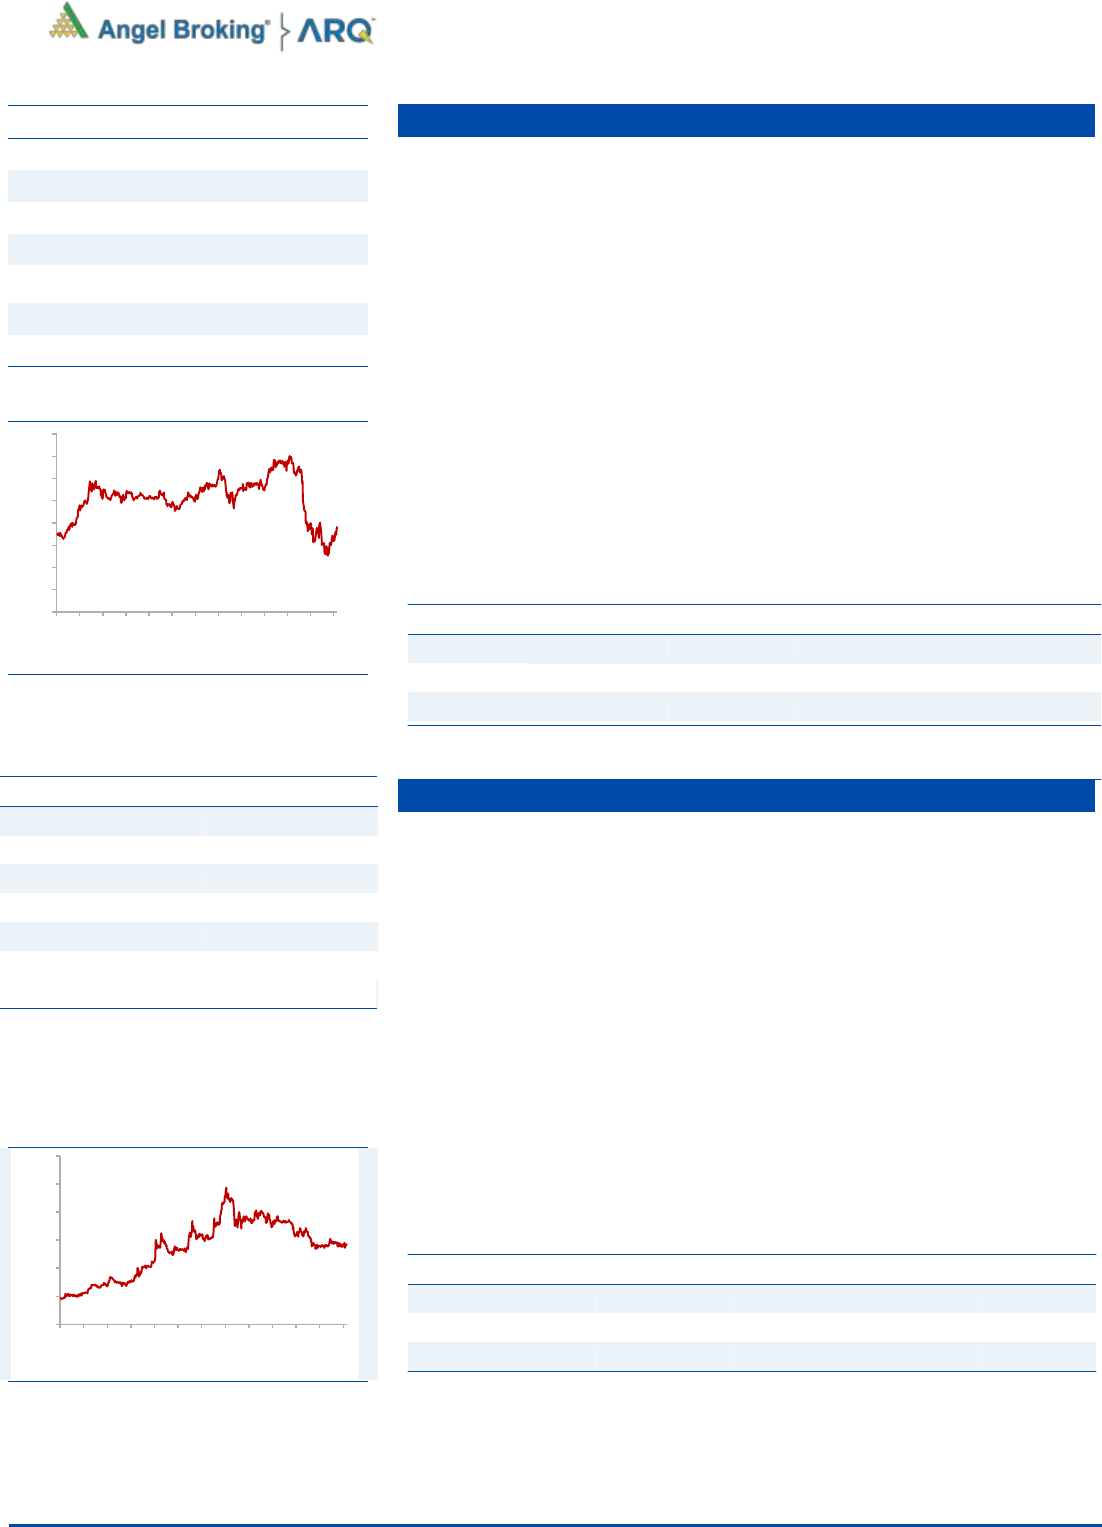
Stock Info
CMP
1,651
TP
2,059
Upside
24.7%
Sector
Machinery
Market Cap (` cr)
2,414
Beta
0.52
52 Week High / Low
1769/994
3 year-Chart
Source: Company, Angel Research
-
200
400
600
800
1,000
1,200
1,400
1,600
1,800
2,000
Dec-16
Mar-17
May-17
Aug-17
Nov-17
Feb-18
May-18
Aug-18
Nov-18
Feb-19
May-19
Aug-19
Nov-19
5
Error!
Refer
ence
sourc
Angel Top Picks | December 2019
December 6, 2019
5
ICICI Bank
ICICI Bank has taken a slew of steps to strengthen its balance sheet viz.
measures like incremental lending to higher rated corporate, reducing
concentration in few stressed sectors and building up the retail loan book. The
share of retail loans in overall loans increased to 61.5% (Q2FY2020) from
38% in FY2012.
ICICI Bank’s slippages remained high during FY2018, and hence, GNPA went
up to 8.8% vs. 5.8% in FY2016. We expect addition to stress assets to reduce
and credit costs to further decline owing to incremental lending to higher rated
corporate and faster resolution in accounts referred to NCLT under IBC.
The gradual improvement in recovery of bad loans would reduce credit costs
which would help to improve return ratio. At the current market price, the
bank’s core banking business (after adjusting the value of subsidiaries) is
trading at 2.1x FY2021E ABV, which is inexpensive considering retail Mix and
strong capitalization (CET-I of 13.24%).
Key Financials
Y/E
NII
NIM
PAT
EPS
ABV
ROA
ROE
P/E
P/ABV
March
(` cr)
(%)
(` cr)
(`)
(`)
(%)
(%)
(x)
(x)
FY2020E
32,145
3.5
9,559
15
165
0.9
9
35
3.1
FY2021E
37,259
3.5
16,443
26
185
1.4
13
20
2.8
Source: Company, Angel Research
Ultratech Cement
Ultratech Cement is India’s largest cement manufacturer with over100mn TPA
of capacity spread across the country with a strong presence in Central, North,
and West India.
The company has added capacity by taking over stressed assets of over
~30mn TPA since 2017. Company took over Century textile’s cement capacity
of 14.4mn TPA in Q2FY20 which will give it 40% plus market share in West
and Central India which are amongst the best regions.
Increased costs due to high energy prices had adversely impacted margins in
1HFY19. However strong pricing discipline due to consolidation allowed
cement companies to hike prices in Q4FY19. Energy prices (coal and pet
coke) have come off significantly since the beginning of 2019 which along
with benign freight costs would allow cement companies to protect margins
despite any marginal dip in realizations.
We are positive on the long term prospects of the company given ramp up
from acquired capacities, pricing discipline in the industry and benign energy
& freight costs.
Key Financials
Y/E
Sales
OPM
PAT
EPS
ROE
P/E
P/BV
EV/Sales
March
(` cr)
(%)
(` cr)
(`)
(%)
(x)
(x)
(x)
FY2020E
43,916
22.3
4051
140
12.3
30.3
4.8
3.2
FY2021E
47,482
22.7
4670
162
11.8
26.3
4.4
2.9
Source: Company, Angel Research
Stock Info
CMP
4,256
TP
4,984
Upside
17.0%
Sector
Cement
Market Cap (` cr)
122,826
Beta
1.33
52 Week High / Low
4,903/3,340
3 year-Chart
Source: Company, Angel Research
-
1,000
2,000
3,000
4,000
5,000
Dec-16
Mar-17
May-17
Aug-17
Nov-17
Feb-18
May-18
Aug-18
Nov-18
Feb-19
May-19
Aug-19
Nov-19
Stock Info
CMP
512
TP
575
Upside
12.3%
Sector
Banking
Market Cap (` cr)
331,037
Beta
1.40
52 Week High / Low
531/336
3 year-Chart
Source: Company, Angel Research
-
100
200
300
400
500
600
Dec-16
Mar-17
May-17
Aug-17
Nov-17
Feb-18
May-18
Aug-18
Nov-18
Feb-19
May-19
Aug-19
Nov-19
6
Error!
Refer
ence
sourc
Angel Top Picks | December 2019
December 6, 2019
6
Larsen & Toubro
L&T is India’s largest EPC company with strong presence across various
verticals including Infra, Hydrocarbon and services segment. The company
also has a very strong presence in the IT services and NBFC space through its
various subsidiary companies which are also growth drivers for the company.
L&T continued to report strong order flows during Q2FY20 despite the quarter
being hampered by economic slowdown. Company reported order flow of
`483bn and retained its guidance of a 10-12% order inflow for the year and
12-15% revenue growth guidance.
Management had indicated a very strong pipeline for FY20 of `9lakh crore
which includes both domestic as well international orders. The company has a
strong order backlog of over `3lakh crore and the pipeline provides strong
visibility for new order flows for the rest of the year.
We are positive on the prospects of the company given the Government’s
thrust on Infrastructure with over 100lakh crore of investments lined up over
the next 5 years.
Key Financials
Y/E
Sales
OPM
PAT
EPS
ROE
P/E
P/BV
EV/Sales
March
(` cr)
(%)
(` cr)
(`)
(%)
(x)
(x)
(x)
FY2020E
91,855
9.8
8637
62
15.6
21.7
3.2
2.0
FY2021E
1,02,877
9.8
8721
62
14.3
21.5
2.9
1.7
Source: Company, Angel Research (Above numbers are of parent entity only).
Maruti Suzuki
Maruti Suzuki continues to maintain ~52% market share in the passenger
vehicles space. The launch of exciting new models has helped the company to
ride on the premiumization wave that is happening in the country. In the last
two years, company has seen improvement in the business mix with increasing
share from utility vehicles.
Company is well placed to capture any revival in industry due to overall
refreshment of portfolio (Already more than 50% of portfolio launched based
on BS6 compliance like Alto, Wagon, Baleno, Dzire, Swift. Recent new
launches in August 2019 also has the potential to contribute significantly to
the Top-line (MPV - XL6 and S-Presso).
Key Financials
Y/E
Sales
OPM
PAT
EPS
ROE
P/E
P/BV
EV/Sales
March
(` cr)
(%)
(` cr)
(`)
(%)
(x)
(x)
(x)
FY2020E
84,277
11.9
6,806
225.4
13.5
32.2
4.3
2.1
FY2021E
90,201
12.6
7,527
249.2
14.0
29.1
4.1
1.9
Source: Company, Angel Research
Stock Info
CMP
7,250
TP
8,552
Upside
18.0%
Sector
Automobile
Market Cap (` cr)
218,994
Beta
1.42
52 Week High / Low
7,929/5,447
3 year-Chart
Source: Company, Angel Research
-
2,000
4,000
6,000
8,000
10,000
12,000
Dec-16
Mar-17
May-17
Aug-17
Nov-17
Feb-18
May-18
Aug-18
Nov-18
Feb-19
May-19
Aug-19
Nov-19
Stock Info
CMP
1,331
TP
1,809
Upside
35.9%
Sector
Infrastructure
Market Cap (` cr)
186,760
Beta
1.30
52 Week High / Low
1607/1203
3 year-Chart
Source: Company, Angel Research
-
200
400
600
800
1,000
1,200
1,400
1,600
1,800
2,000
Dec-16
Mar-17
May-17
Aug-17
Nov-17
Feb-18
May-18
Aug-18
Nov-18
Feb-19
May-19
Aug-19
Nov-19
7
Error!
Refer
ence
sourc
Angel Top Picks | December 2019
December 6, 2019
7
RBL Bank
RBL Bank (RBK) has grown its loan book at healthy CAGR of 53% over
FY2010-19. We expect it to grow at 27% over FY2019-21E. With an
adequately diversified, well capitalised balance sheet, RBK is set to grab
market share from corporate lenders (mainly PSUs).
During Q2FY20 the retail loan portfolio grew 62% yoy to `20,138cr and now
constitutes 34% of the loan book (from 18% share in 4QFY2017). NIM has
expanded to 4.35%, up 27bps yoy despite a challenging interest rate scenario
on the back of a changing portfolio mix. However, the management disclosed
stressed asset worth `1,800cr, which will increase GNPA to 2.25%.
Management is confident that it would normalize by Q1FY2021.
RBL Bank currently trading at 1.7x its FY2021E book value per share, which
we believe is reasonable for a bank in a high growth phase with improving
retail loan mix and building strong retail liability franchise.
Key Financials
Y/E
NII
NIM
PAT
EPS
ABV
ROA
ROE
P/E
P/ABV
March
(` cr)
(%)
(` cr)
(`)
(`)
(%)
(%)
(x)
(x)
FY2020E
3,258
3.7
687
15
194
0.8
8
25
1.9
FY2021E
4,149
3.7
1,580
35
220
1.3
16
11
1.7
Source: Company, Angel Research
Safari Industries
Safari Industries Ltd (Safari) is the third largest branded player in the Indian
luggage industry. Post the management change in 2012, Safari has grown its
revenue by 6x in the last 7 years. This has been achieved by foraying in many
new categories like back pack, school bags (via acquisition of Genius and
Genie) and improvement in distribution networks.
Its margins have more than doubled from 4.1% in FY2014 to 9.1% in FY2019,
driven by launch of new product categories and business. We expect it to
maintain 9%+ margins from FY2018 onwards led by regular price hikes, shift
towards organized player and favorable industry dynamics.
We expect its revenue to grow by a CAGR of ~23%/23.5% in revenue/
earnings over FY2019-21E on the back of growth in its recently introduced
new products.
Key Financials
Y/E
Sales
OPM
PAT
EPS
ROE
P/E
P/BV
EV/Sales
March
(` cr)
(%)
(` cr)
(`)
(%)
(x)
(x)
(x)
FY2020E
753
9.1
36
16
18.1
35.2
8.4
1.8
FY2021E
910
10.0
50
22
20.4
25.5
6.8
1.5
Source: Company, Angel Research
Stock Info
CMP
374
TP
440
Upside
17.6%
Sector
Banking
Market Cap (` cr)
16,101
Beta
1.92
52 Week High / Low
717/230
3 year-Chart
Source: Company, Angel Research
-
100
200
300
400
500
600
700
800
Dec-16
Mar-17
May-17
Aug-17
Nov-17
Feb-18
May-18
Aug-18
Nov-18
Feb-19
May-19
Aug-19
Nov-19
Stock Info
Stock Info
CMP
571
CMP
395
TP
646
TP
537
Upside
13.1%
Upside
35.8%
Sector
Luggage
Sector
Media
Market Cap (` cr)
1,276
Market Cap (` cr)
2,356
Beta
0.53
Beta
0.9
52 Week High / Low
829/481
52 Week High / Low
557/341
3 year-Chart
3 year-Chart
Source: Company, Angel Research
Source: Company, Angel Research
-
200
400
600
800
1,000
1,200
Dec-16
Mar-17
May-17
Aug-17
Nov-17
Feb-18
May-18
Aug-18
Nov-18
Feb-19
May-19
Aug-19
Nov-19
8
Error!
Refer
ence
sourc
Angel Top Picks | December 2019
December 6, 2019
8
Shriram Transport
SHTF's primary focus is on financing pre-owned commercial vehicles. We
expect AUM growth to improve going ahead led by (1) good monsoon which
will improve rural economic activity, (2) pick-up in infra/construction, which
was subdued since 2019 elections, (3) ramping up in rural distribution.
SHTF gradually expanded its offering to existing borrower with good track
record. New offering includes business loan and working capital which cover
overall truck business owner requirement (payment at petrol pump/ tyre
dealers, insurance premium).We expect asset quality to remain stable owing to
lower LTVs since 3QFY2019 and stable collateral value as used CV prices to
improve or remain stable in a BS6 regime.
We expect SHTF to report RoA/RoE of 3%/18.3% in FY2021E respectively. At
CMP, the stock is trading at 1.2x FY2021E ABV and 7x FY2021E EPS, which
we believe is reasonable for differentiated business model with high return
ratios.
Key Financials
Y/E
NII
NIM
PAT
EPS
ABV
ROA
ROE
P/E
P/ABV
March
(` cr)
(%)
(` cr)
(`)
(`)
(%)
(%)
(x)
(x)
FY2020E
8,572
8.1
3,157
139
823
2.9
18.3
8
1.4
FY2021E
9,604
8.2
3,713
164
970
3.0
18.3
7
1.2
Source: Company, Angel Research
Exhibit 2: Changes in Recommendation
Effective Date
Stock
Price
Change in recommendation
(`)
From
To
22-11-2018
Yes Bank
196
Buy
Hold
06-06-2019
Ashok Leyland
70
Buy
Hold
06-06-2019
GIC Housing
243
Buy
Hold
06-06-2019
Inox Wind
55
Buy
Hold
06-06-2019
Music Broadcast
46
Buy
Hold
06-06-2019
Siyaram Silk Mills
255
Buy
Hold
06-09-2019
Parag Food Milks
137
Buy
Hold
06-09-2019
Bata India
1545
Buy
Hold
06-09-2019
Aditya Birla Capital
93
Buy
Hold
05-10-2019
Jindal Steel
94
Buy
Hold
06-11-2019
M&M
580
Buy
Sell
08-11-2019
TTK Prestige
6075
Buy
Sell
13-11-2019
KEI Industries
542
Buy
Hold
29-11-2019
Yes Bank
65
Hold
Sell
06-12-2019
Ashok Leyland
76
Hold
Sell
Hold – While we recommend to Hold on to existing positions at current level, we would await
for further data points before recommending any fresh purchases.
Stock Info
CMP
1,127
TP
1,410
Upside
25.1%
Sector
Financials
Market Cap (` cr)
25,572
1.52
52 Week High / Low
1297/910
3 year-Chart
Source: Company, Angel Research
-
200
400
600
800
1,000
1,200
1,400
1,600
1,800
Dec-16
Mar-17
May-17
Aug-17
Nov-17
Feb-18
May-18
Aug-18
Nov-18
Feb-19
May-19
Aug-19
Nov-19

9
Error!
Refer
ence
sourc
Angel Top Picks | December 2019
December 6, 2019
9
Research Team Tel: 022 - 39357800 E-mail: [email protected] Website: www.angelbroking.com
DISCLAIMER
Angel Broking Limited (hereinafter referred to as “Angel”) is a registered Member of National Stock Exchange of India Limited, Bombay
Stock Exchange Limited, Metropolitan Stock Exchange Limited, Multi Commodity Exchange of India Ltd and National Commodity &
Derivatives Exchange Ltd It is also registered as a Depository Participant with CDSL and Portfolio Manager and Investment Adviser with
SEBI. It also has registration with AMFI as a Mutual Fund Distributor. Angel Broking Limited is a registered entity with SEBI for Research
Analyst in terms of SEBI (Research Analyst) Regulations, 2014 vide registration number INH000000164. Angel or its associates has not
been debarred/ suspended by SEBI or any other regulatory authority for accessing /dealing in securities Market. Angel or its
associates/analyst has not received any compensation / managed or co-managed public offering of securities of the company covered
by Analyst during the past twelve months.
This document is solely for the personal information of the recipient, and must not be singularly used as the basis of any investment
decision. Nothing in this document should be construed as investment or financial advice. Each recipient of this document should
make such investigations as they deem necessary to arrive at an independent evaluation of an investment in the securities of the
companies referred to in this document (including the merits and risks involved), and should consult their own advisors to determine
the merits and risks of such an investment.
Reports based on technical and derivative analysis center on studying charts of a stock's price movement, outstanding positions and
trading volume, as opposed to focusing on a company's fundamentals and, as such, may not match with a report on a company's
fundamentals. Investors are advised to refer the Fundamental and Technical Research Reports available on our website to evaluate the
contrary view, if any
The information in this document has been printed on the basis of publicly available information, internal data and other reliable
sources believed to be true, but we do not represent that it is accurate or complete and it should not be relied on as such, as this
document is for general guidance only. Angel Broking Limited or any of its affiliates/ group companies shall not be in any way
responsible for any loss or damage that may arise to any person from any inadvertent error in the information contained in this report.
Angel Broking Limited has not independently verified all the information contained within this document. Accordingly, we cannot testify,
nor make any representation or warranty, express or implied, to the accuracy, contents or data contained within this document. While
Angel Broking Limited endeavors to update on a reasonable basis the information discussed in this material, there may be regulatory,
compliance, or other reasons that prevent us from doing so.
This document is being supplied to you solely for your information, and its contents, information or data may not be reproduced,
redistributed or passed on, directly or indirectly.
Neither Angel Broking Limited, nor its directors, employees or affiliates shall be liable for any loss or damage that may arise from or in
connection with the use of this information.
Disclosure of Interest Statement
Top Picks
1. Financial interest of research analyst or Angel or his Associate or his relative
No
2. Ownership of 1% or more of the stock by research analyst or Angel or associates or
relatives
No
3. Served as an officer, director or employee of the company covered under Research
No
4. Broking relationship with company covered under Research
No
Ratings (Based on Expected Returns: Buy (> 15%) Accumulate (5% to 15%) Neutral (-5 to 5%)
Over 12 months investment period) Reduce (-5% to -15%) Sell (< -15%)
Hold (Fresh purchase not recommended)